INDI Library v2.0.7 is Released (01 Apr 2024)
Bi-monthly release with minor bug fixes and improvements
New KStars/Ekos Module: Analyze
- Ferrante Enriques
-
- Offline
- Elite Member
-

- Posts: 249
- Thank you received: 62
Replied by Ferrante Enriques on topic New KStars/Ekos Module: Analyze
Astrodom keeps track of imaging frames only, so the main source of information (beside reading fits headers) would be the CaptureComplete tagged line.
To me it would be nice to have on that line also data not directly related to the frame. For example, average RMS during capture and SNR.
Other capture related data like eccentricity and noise would also be nice to have, when will be available. I would rather read those from .analyze than from PI because have to run SubframeSelector first.
ferrante
Please Log in or Create an account to join the conversation.

Replied by Dean on topic New KStars/Ekos Module: Analyze
- from the timeline graph of the guide activity, I can click on a section and view the rms scatter plot. Is
it possible to ctrl or shift click or some other select action to plot multiple segments ?
am guiding with dithering, which breaks up the rms record, but would like to see the rms plot for the whole guide session
- playback of the guide rms scatter plot showing accumulation of data points ?
- can the data be exported to a phd2 log viewer readable text file ?
Please Log in or Create an account to join the conversation.
- Hy Murveit
-
 Topic Author
- Offline
- Administrator
-

- Posts: 1222
- Thank you received: 565
Replied by Hy Murveit on topic New KStars/Ekos Module: Analyze
Answers inline.
>> would like to see the rms plot for the whole guide session
To be clear, I assume you're talking about the plot in the lower right hand corner with 2 concentric circles
(because you already can see the drift graphs for the whole time period).
It's possible to add that, but I'm unclear of the semantics of selecting multiple sessions.
Can you suggest? E.g. what would it mean to select multiple captures or multiple focus sessions?
FYI, I believe I have one control-click in there already (to reset the y-axis), so I understand how to add
those click modifiers. In an early version of this I had a help-popup to show all these things, but
it got moved to online doc, and, unfortunately, somehow the process is for adding to the online doc
is currently broken

>> playback of the guide rms scatter plot showing accumulation of data points ?
Do you mean an animation, where you see one point then another ... sort of a "real-time playback"?
If so, I also thought of doing animations like that (but for autofocus), but in the end decided that it was not a v1.0 feature.
I'm curious, why do you think it would be useful?
>> can the data be exported to a phd2 log viewer readable text file ?
This is a separate topic from Analyze, but guiding data can be (usually is) exported to PHD2 format.
Make sure that the checkbox called "Save Internal Guider User Log" is checked
(you find that in the Options-->Guide section in the lower right corner of the Guide Tab)
and then you can find your log in a sister directory to the main logs.
On linux that would be in ~/.local/share/kstars/guidelogs/*
It has been that way for several months, so you may have old guide logs there you can look at with phdlogview
(or, alternatively, you can now use analyze to see guiding, though its input is a different file format).
Hy
Please Log in or Create an account to join the conversation.
Replied by Dean on topic New KStars/Ekos Module: Analyze
terms. I develop software for medical image analysis / review and find interpreting
changes statically or over time visually is insightful. I read a number of posts here and on CN around guiding
issues and having experienced poor guiding performance and wanted to review my data
in phd log viewer but the .csv file I saved from Ekos would not load. I can review prior .activity files in
Ekos but a review in phd log viewer may be more helpful for now.
A typical session: I work at 1 or more imaging targets. My process is (after PA) to select, slew to,
capture and solve with guide scope / camera then loop on the main camera and nudge the mount to
center the target, then start guiding with dithering every frame or some other periodicity. The
analysis tab shows sections of guiding followed by gaps due to other activity: finding a different
target, focusing, dithering etc., so within an acquisition session there are "rms gaps". I want
to plot the rms scatter for that session cumulatively (ie, ignoring gaps) or in time progression
via animation. I am also unclear on semantics since it could depend on workflow. What if the user
determines that for now: ala file explorer apps wherein you ctrl click for individual (in time sequence)
sections and shift click for the whole shuhbang?
Please Log in or Create an account to join the conversation.
- Hy Murveit
-
Topic Author
- Offline
- Administrator
-
- Posts: 1222
- Thank you received: 565
Replied by Hy Murveit on topic New KStars/Ekos Module: Analyze
I don't think you're looking at the right file (for viewing Ekos guiding with phdlogview).
On linux it would be found in ~/.local/share/kstars/guidelogs/
and, for instance, the one that's being saved for me tonight is named:
~/.local/share/kstars/guidelogs/guide_log-2020-09-15T22-30-35.txt
If you look at the start of it, the first few lines might be:
> head guide_log-2020-09-15T22-30-35.txt
KStars version 3.5.0. PHD2 log version 2.5. Log enabled at 2020-09-15 22:30:35

Guiding Begins at 2020-09-15 22:30:35
Pixel scale = 1.32 arc-sec/px, Binning = 1, Focal length = 588 mm
RA = 19.65 hr, Dec = 25.8 deg, Hour angle = N/A hr, Pier side = East, Rotator pos = N/A, Alt = 68.5 deg, Az = 243.3 deg
Mount = mount, xAngle = 15.1, xRate = 4.635, yAngle = 107.1, yRate = 2.751
Frame,Time,mount,dx,dy,RARawDistance,DECRawDistance,RAGuideDistance,DECGuideDistance,RADuration,RADirection,DECDuration,DECDirection,XStep,YStep,StarMass,SNR,ErrorCode
1,4.204,"Mount",0.000,0.000,0.398,0.179,0.236,0.000,51,W,0,,,,10275,66.87,0
INFO: Server received PAUSE
INFO: Server received RESUME
If you don't see that directory, perhaps you don't have that checkbox checked?
Please let me know if you still have trouble finding it, or if doesn't work with phdlogview.
Hy
Please Log in or Create an account to join the conversation.
Replied by Dean on topic New KStars/Ekos Module: Analyze
thanks for the reply. I saved what I thought was the guide log to a user selected directory on
my pi running SM OS. It was well after midnight and my brain fog has left me with no idea
how I did that save to file... probably the save button under the drift plot on the guide page.
The file is comma delim unquoted text: csv. Here are the first few lines
Frame #, Time Elapsed (sec), Local Time (HMS), RA Error (arcsec), DE Error (arcsec), RA Pulse  (ms), DE Pulse (ms)
0,3.731,10:38:49 PM,0,0,0,0,
1,5.381,10:38:51 PM,0.726482,-0.0765854,-59,0,
2,8.741,10:38:54 PM,0.333473,-0.962496,-27,128,
3,10.674,10:38:56 PM,0.660558,-0.607185,-53,0,
4,14.013,10:39:00 PM,0.0650261,-0.279312,0,0,
5,15.993,10:39:01 PM,-0.594562,-0.475873,48,0,
It seems to open in log viewer but nothing indicates anything being read. I installed v0.6.4
off the pch-ppa . Maybe I should try building from source.
Please Log in or Create an account to join the conversation.
Replied by Greg on topic New KStars/Ekos Module: Analyze
- The HFR value is always 0. If I open one of the fits files I do see the measurement is there.
- skyBg has a value but its presentation on the graph appears to be just a flat line at the bottom so you can't any detail on minor changes sub to sub. No way to zoom in to see fluctuation over time.
Please Log in or Create an account to join the conversation.
- Hy Murveit
-
Topic Author
- Offline
- Administrator
-
- Posts: 1222
- Thank you received: 565
Replied by Hy Murveit on topic New KStars/Ekos Module: Analyze
To do that, you need to check an option in FITS settings--see the attached image, look for "Auto Compute HFR".
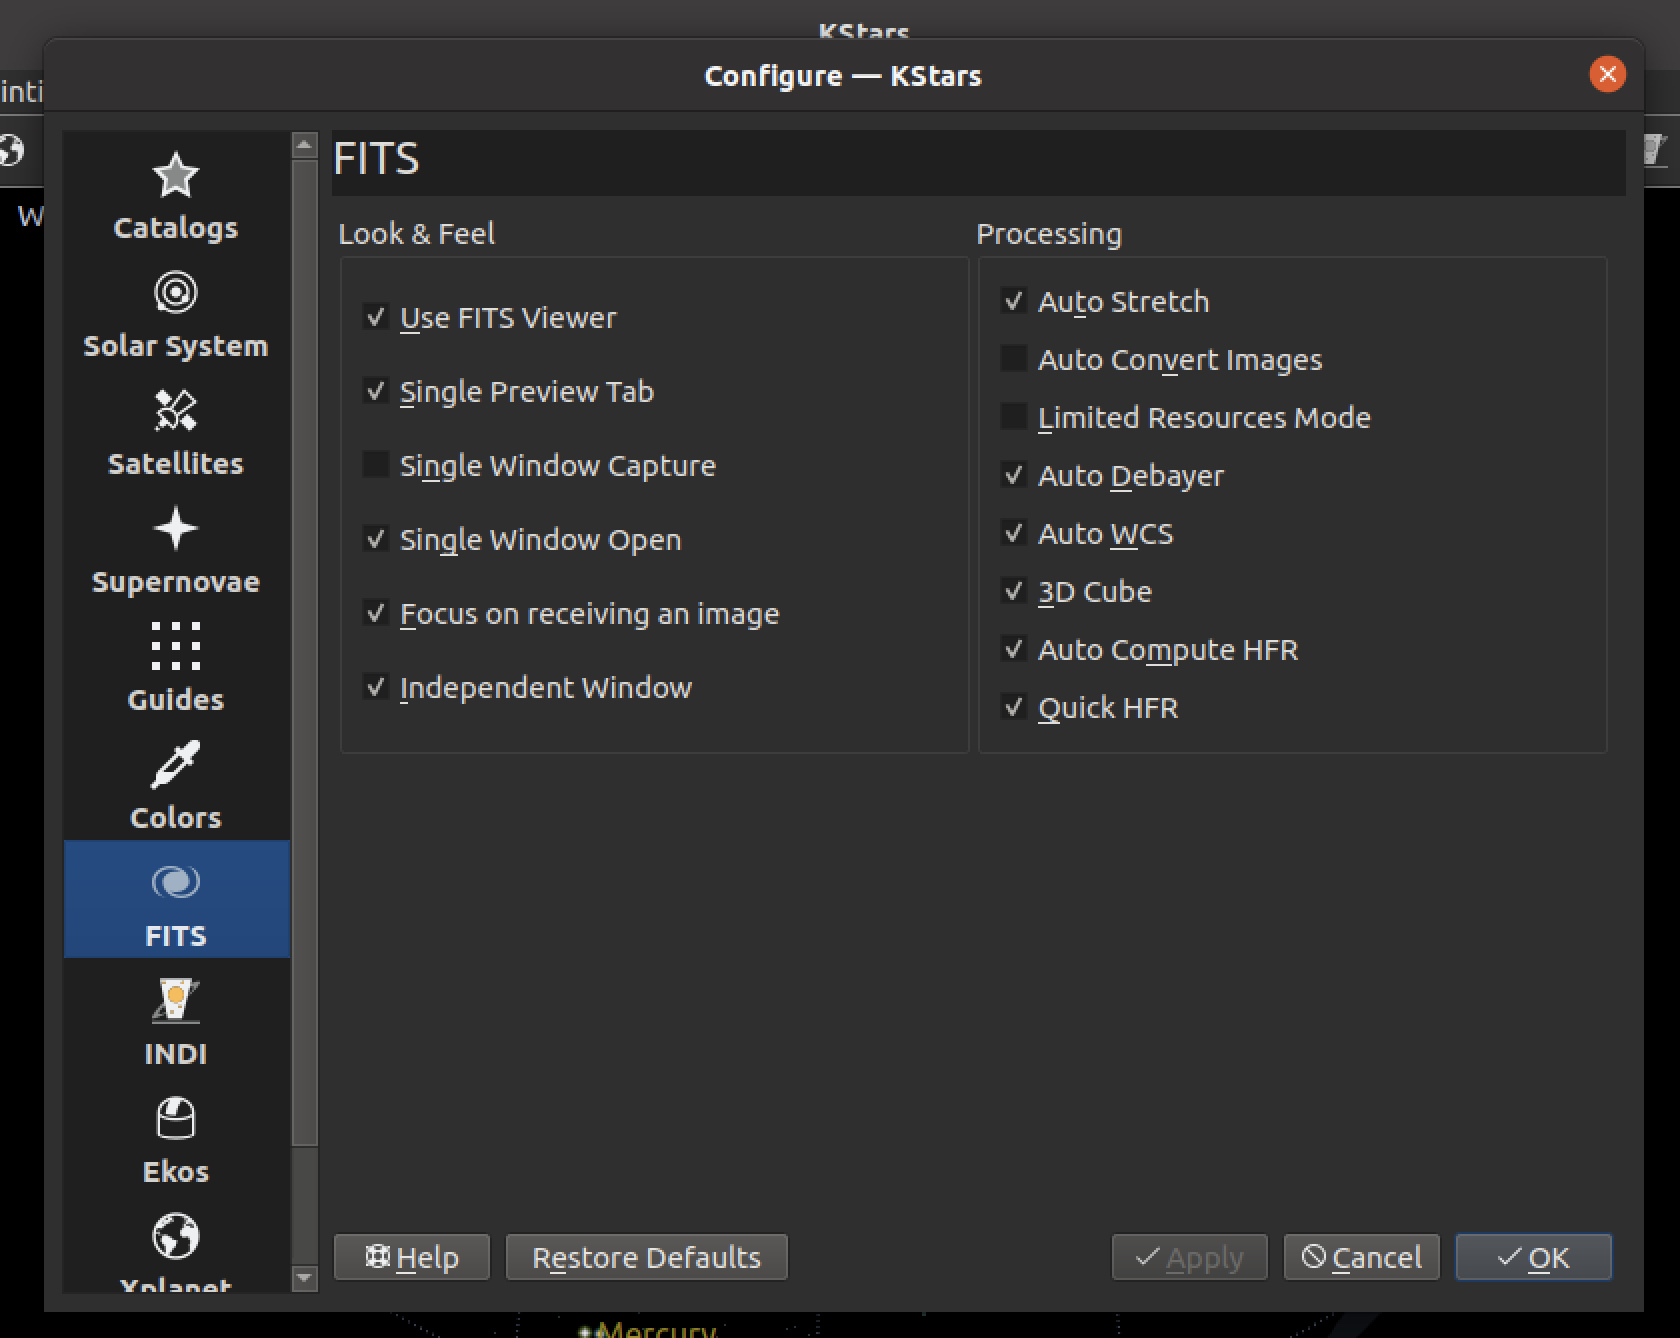
FYI, You're absolutely right, this is a common problem, and I tried to have a pop-up alert folks of this,
which is triggered if you check the HFR box when the "auto compute HFR" option is not set.
Let me know if the popup doesn't happen (e.g. you uncheck and then check without the FITS option and don't see a popup)
Perhaps the problem is that HFR is on by default, so you don't ever need to check it?
Hy
Please Log in or Create an account to join the conversation.
- Scott Denning
-
- Offline
- Elite Member
-
- Posts: 300
- Thank you received: 57
Replied by Scott Denning on topic New KStars/Ekos Module: Analyze
L, R, G, B, Ha, O3, S2
Thank you for your wonderful contributions to this project!
Please Log in or Create an account to join the conversation.
- Hy Murveit
-
Topic Author
- Offline
- Administrator
-
- Posts: 1222
- Thank you received: 565
Replied by Hy Murveit on topic New KStars/Ekos Module: Analyze
Greg,
re skyBg, for now I believe that getting values for that requires using SEP MultiStar for guiding (which is where the skyBG gets computed).
This may change when the stellar solver happens. For now, Analyze just "takes what it can get" as opposed to computing these things somehow.
It should say this on the mouse-over help, but, I know that's not a totally reliable way of informing users.
As I recall, you were having issues with the SEP Multistar and your ONAG, so perhaps you moved away from that.
Let me know if you're not getting it with SEP MultiStar.
Hy
Please Log in or Create an account to join the conversation.
Replied by Greg on topic New KStars/Ekos Module: Analyze
I did notice the value was -1 previously so I found and turned on Auto Compute HFR in the settings. From that point it now reads as zero. I see you also have Quick HFR enabled. I don't. I'll give that a shot.
I just disabled auto compute hfr and checked the graph checkbox and I did get the popup. I don't recall seeing it previously.
Perhaps what you can do in cases where it is not computed is put 'off' in the field.
Re: skyBg, the tool tip popup is clear as to where the data comes from. I'm using SEP Multistar so I am getting values. The values are present if I scan the timeline, just the graph is flat. I figured out why. Turns out my guider was still imaging as the sky brightened, and the tail of it has backgrounds that rapidly increase. If you look at the tail of the graph (way after the last sub so I didn't see it) it does climb rapidly, which shoves the useful stuff down into the floor of the graph. If I delete those lines from the .analyze file the graph is now presenting useful data.
Please Log in or Create an account to join the conversation.
- Hy Murveit
-
Topic Author
- Offline
- Administrator
-
- Posts: 1222
- Thank you received: 565
Replied by Hy Murveit on topic New KStars/Ekos Module: Analyze
I think all those are already covered.
invent.kde.org/education/kstars/-/blob/m...yze/analyze.cpp#L151
However, if you notice your filters not being color-coded in Analyze, please let me know.
Hy
Please Log in or Create an account to join the conversation.