×

INDI Library v2.0.7 is Released (01 Apr 2024)

Bi-monthly release with minor bug fixes and improvements

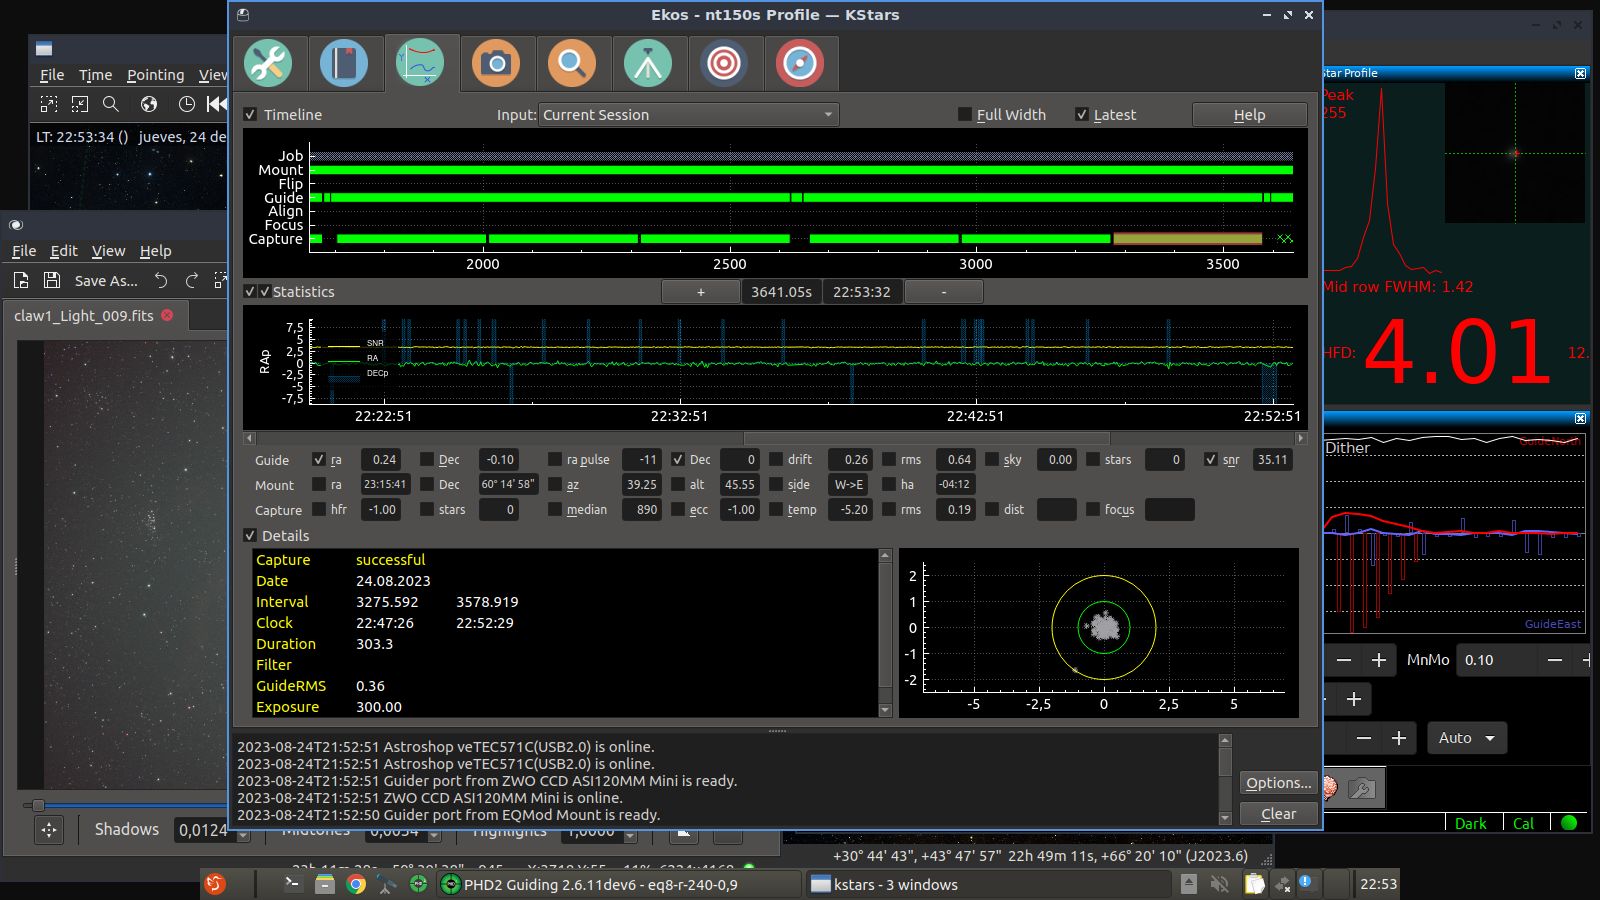
analyze: plot goes off scale

  • Posts: 969
  • Thank you received: 94
Hi everyone

See the plot of DEC pulses below.

Is there any way to scale the graph so that:
- dec pulses originated from a different plot (not the RA plot)
- their magnitude could be seen
(this used to happen automatically with 3.6.5)

analyze and log: drive.google.com/drive/folders/1sSbI3mr0...oBcP1?usp=drive_link

TIA,
Steve

Last edit: 8 months 2 days ago by alacant.
8 months 2 days ago #95157
Attachments:

Please Log in or Create an account to join the conversation.

  • Posts: 91
  • Thank you received: 17
Hi Alacant,

you can scale each values as you want in analyze module, look at the documentation of Kstars in chapitre 5.8.11 Analyze (page 157).

[edit] I quote the documentation for you : " Double clicking on that box will bring up a
menu allowing you to adjust the statistic’s plotted y-range (e.g. setting it to auto, explicitly typing
in the range, setting it back to its default value, and also changing the color of that statistic’s plot) "

Valentin
150P and 72ED with ASI 071 MC pro
Guiding with qhy 5L-II-m and ASI 178MC
HEQ5 pro with EqMod
Kstars Ekos on lenovo thinkcenter with Linux Mint 21
The following user(s) said Thank You: alacant, Peter Sütterlin
Last edit: 8 months 2 days ago by Val Chevalier.
8 months 2 days ago #95165

Please Log in or Create an account to join the conversation.

Time to create page: 0.693 seconds